Data / IT · Lead
Solo project
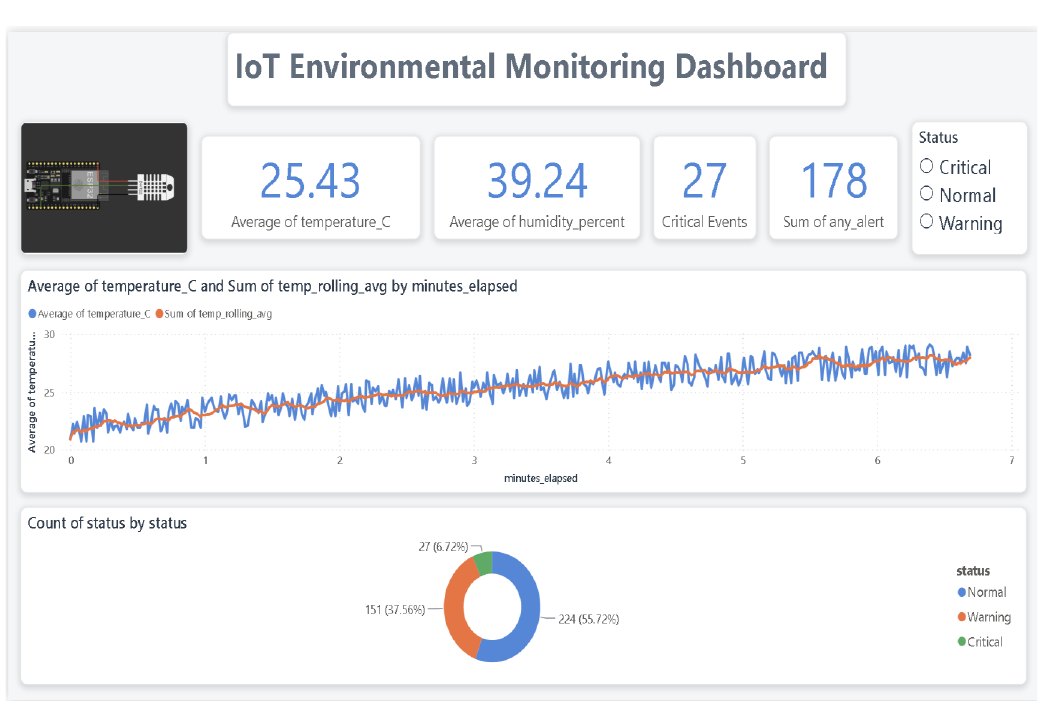
IoT Environmental Monitoring & Analytics Dashboard
A full pipeline from simulated sensors to a Power BI dashboard that flags dangerous air conditions.
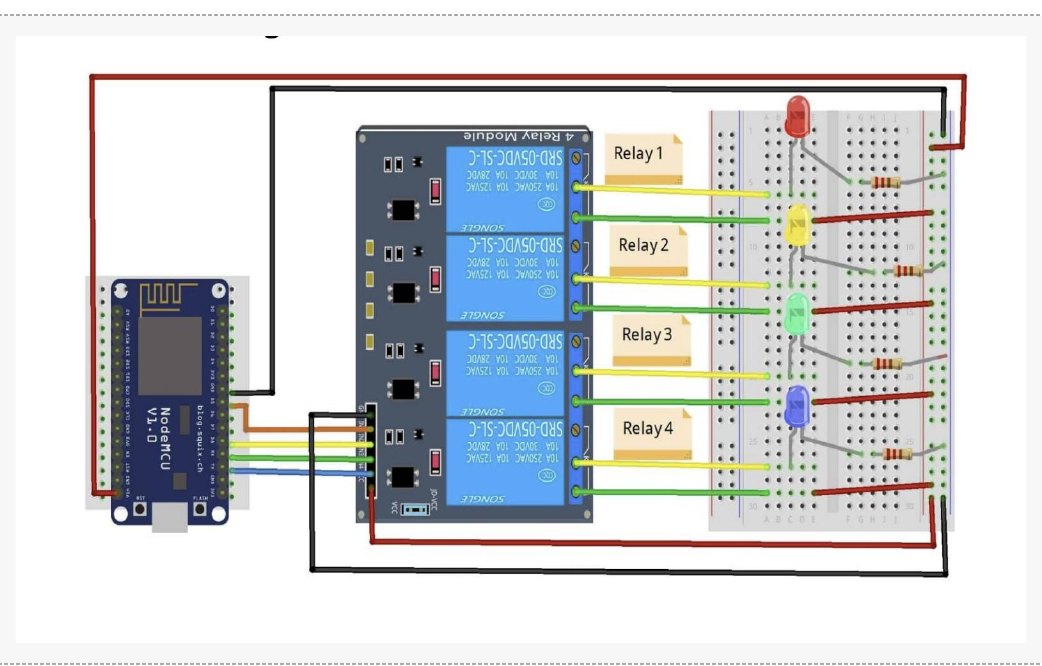
Built an end-to-end IoT data project: an ESP32 with a DHT22 sensor simulated in Wokwi, a Python pipeline to clean and structure the readings, and a Power BI dashboard with custom DAX measures on top. The dashboard revealed that 41% of readings breached safe environmental thresholds, including 27 critical events that would warrant immediate action in a real deployment.